The safetime® Inspection Pie Chart
safetime®‘s online portal offers a wide range of great features, but the one feature we find our clients love and use the most is the inspection pie chart (See our features page for more).
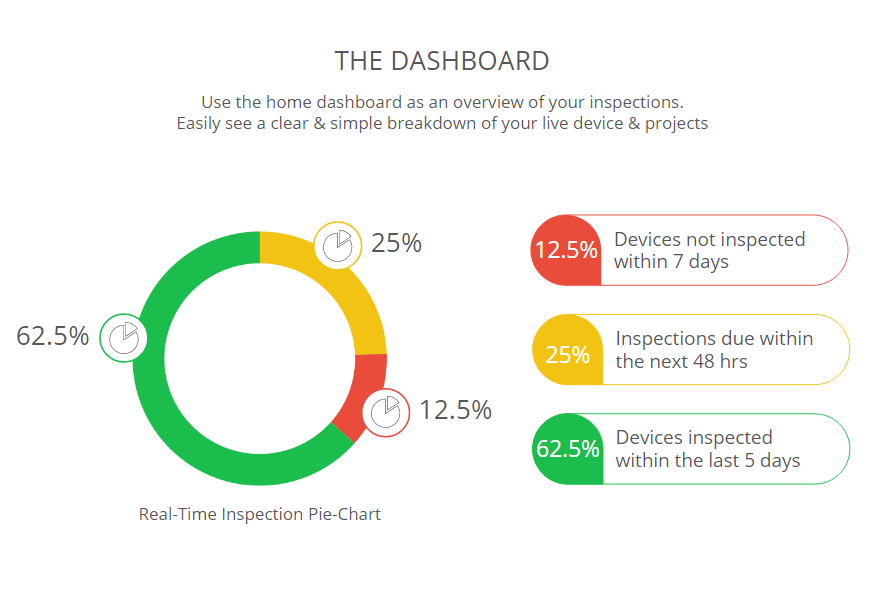
What Is The safetime® Pie Chart?
The pie chart is the first thing you see on the portal dashboard once you log in. It provides a very quick and clear overview of all your scaffolding inspection devices, and whether or not they have been inspected within the last 7 days. It simple terms, it acts as a traffic light colour system, where the colour determines whether the situation is good or bad, e.g. Green means everything is good and up to date!
The simple nature of the pie chart provides the user with immediate visual knowledge of all their scaffolding projects. In terms of scaffolding inspection requirements, it is very simple to determine whether your projects are meeting these requirements and are safe to use.
Let’s take a look at two pie chart examples & what each one means:
Below are two examples of how the pie chart could look on your dashboard. One represents a bad situation, where most of the devices have not been inspected within the last 7 days, and the other represents a good situation, where all devices have been inspected within the last 7 days.
Pie Chart Example No.1:
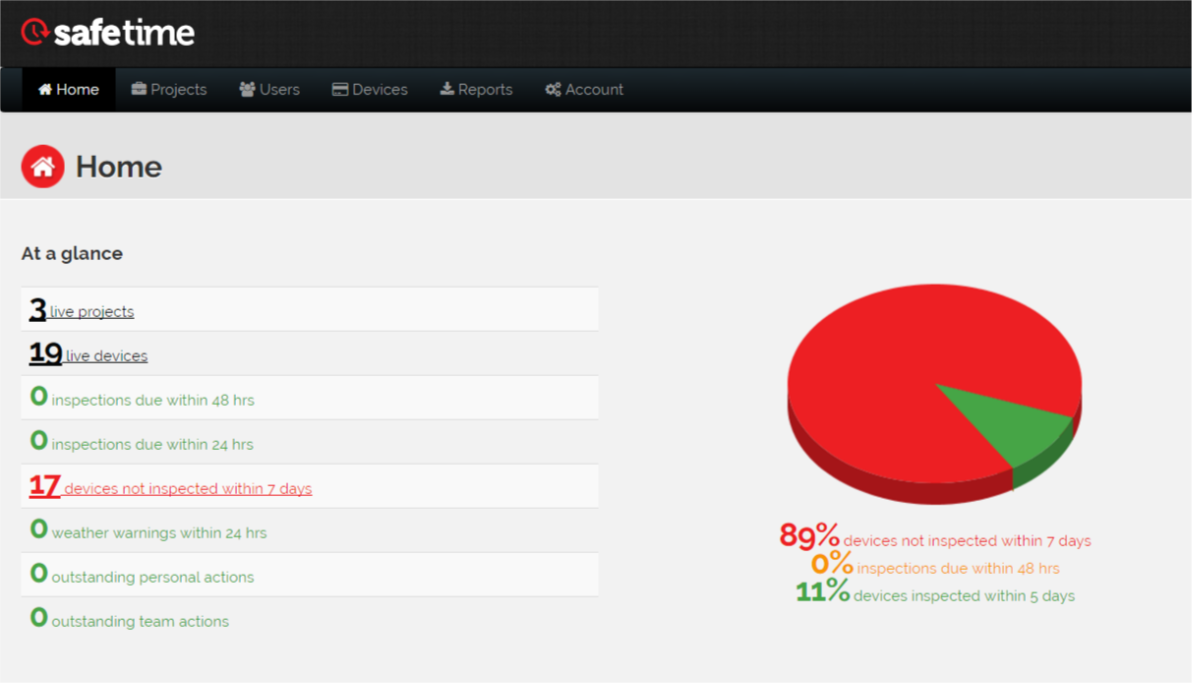
As an administrator of the portal (e.g. a manager, health & safety officer, project manager) you will never want to see the pie chart looking like this. The large proportion of red immediately indicates that most of your devices have not be inspected within the last 7 days, therefore breaching safety requirements, and putting users of the scaffold at risk.
Hopefully, the pie chart should never look like this, as most companies do take inspections seriously. However, if the chart does start to look like this, it is very helpful in providing you with this serious information so that the problem can be quickly resolved.
Pie Chart Example No.2:
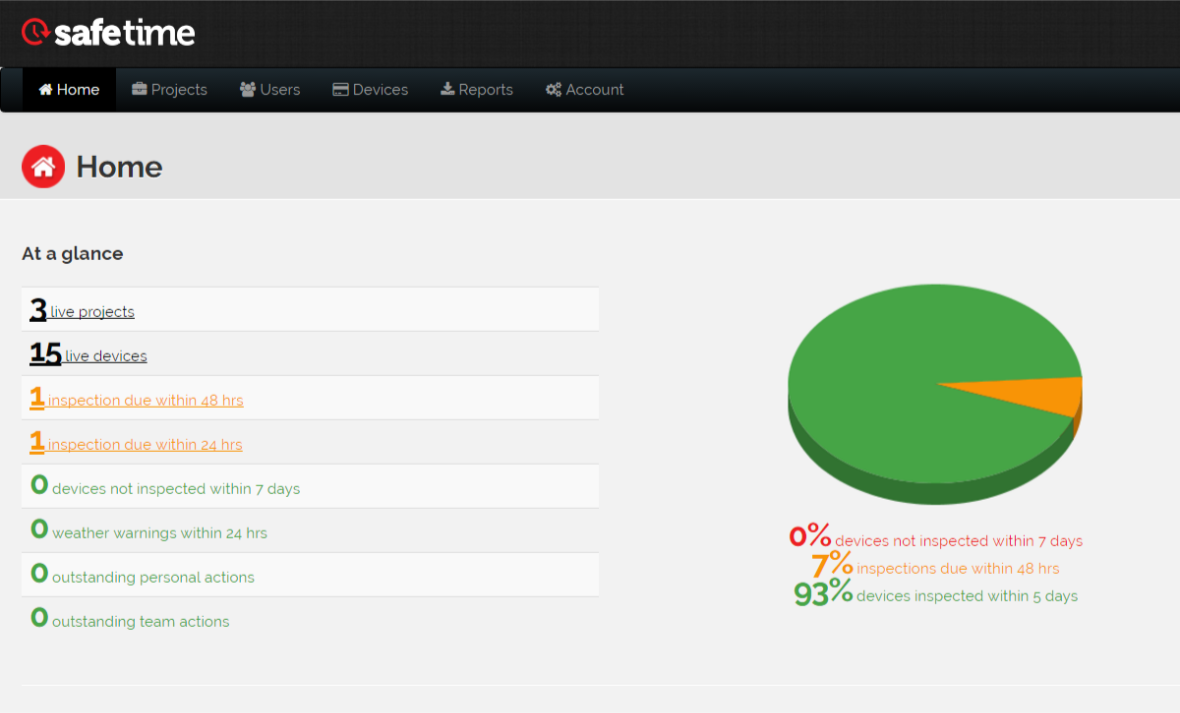
If inspections are done a regular basis, within required 7 day period, the pie chart should always look similar to this. The large proportion of green indicates immediately that all devices are being properly inspected on time and that there is nothing to worry about in terms of the safety of the scaffolds.
The amber segment of the chart also gives the user a quick notification that there are devices that are due to be inspected within the next 48 hours. It acts as a good warning that scaffolding inspections will soon be due, allowing you to manage your project more effectively.
Conclusion:
In conclusion, despite being a small and simple feature of safetime®, it is one of the most useful and effective tools for managing your scaffolding inspections.
In terms of health and safety, this simple feature can have a massive effect on making sure safety is always maintained and notifying you when safety levels may be slipping within your scaffolding projects.